Summary. Amazon looks like the world’s biggest store, but it is run, financially, like a cloud-computing company with a very large logistics hobby. In 2025, AWS was ~18% of revenue and ~57% of operating profit.
Amazon is the rare company that is simultaneously a low-margin retailer, a high-margin software business, and a fast-growing advertising platform — all consolidated into a single income statement. That combination makes its headline numbers genuinely misleading: total revenue growth says almost nothing about why Amazon is profitable, because the profit lives somewhere very specific. The segment mix tells the real story.
What follows decomposes that story — where the revenue comes from, where the costs go, how the picture has shifted since 2021, and whether the reported profits actually turn into cash. The segment and cost figures are taken from Amazon’s FY2025 Form 10-K and Q1 2026 results; the stock prices are pulled live from Yahoo Finance.
1. The headline contradiction
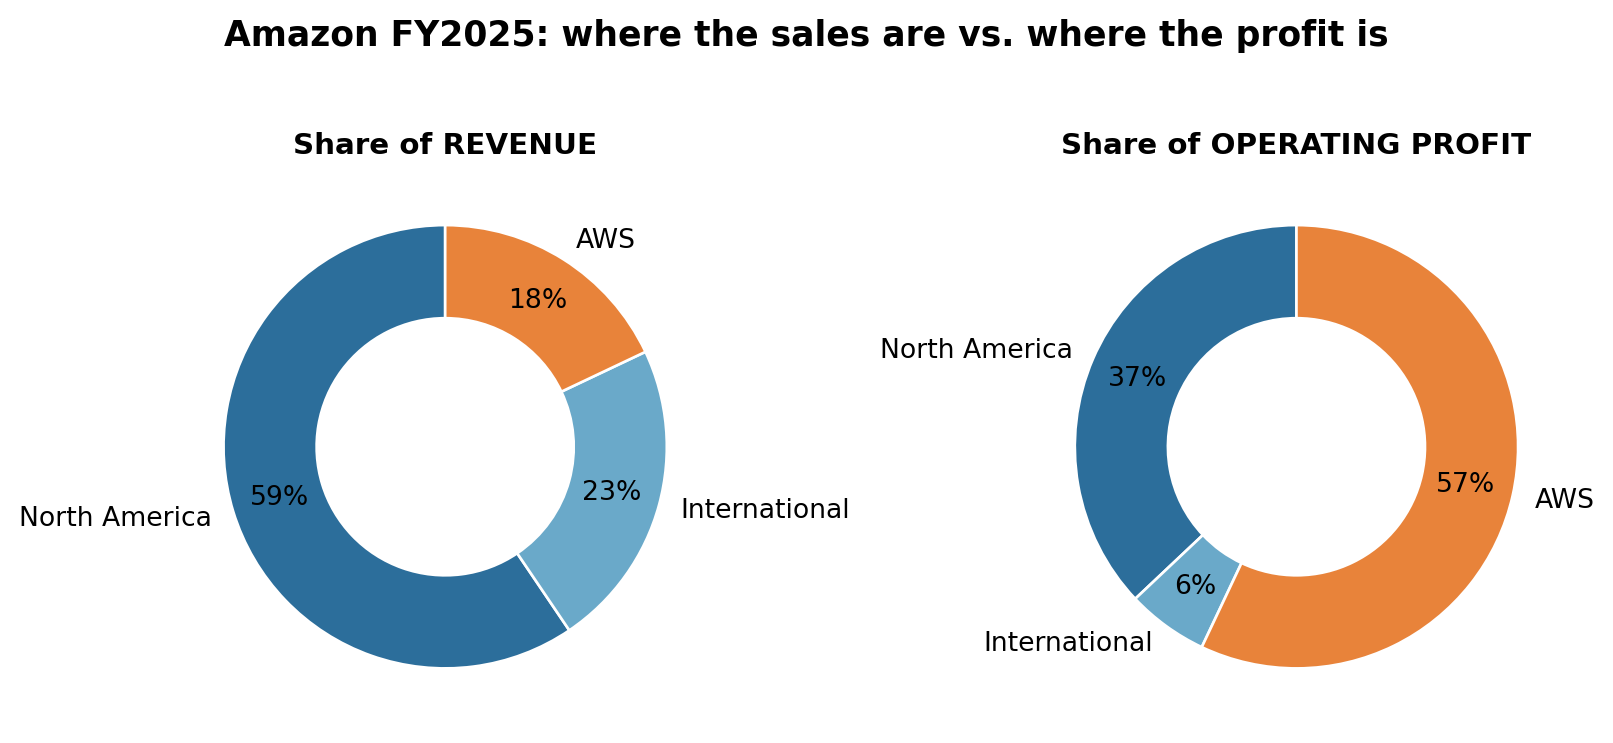
The single chart that frames everything: for fiscal 2025, each segment’s share of revenue sits next to its share of operating profit.
AWS is ~18% of sales but ~57% of operating profit. North America does the opposite: ~59% of sales, ~37% of profit. The retail machine generates the volume; the cloud generates the margin.
2. Where the money goes
The cleanest way to show a company’s cost structure is a waterfall from net sales down to operating income — each step is a category of spend that Amazon discloses on the face of its income statement.
A couple of things jump out. Cost of sales (≈50% of revenue) is the physical reality of being a retailer — the goods themselves and shipping. But notice technology & infrastructure: at ~$109B it has nearly caught up with fulfillment (~$109B) and is the fastest-growing line, reflecting the capex and depreciation behind AWS and the current AI build-out.
3. The trend: how the mix shifted, 2021–2025
A single year is a snapshot. The interesting story is the trajectory.
Revenue growth is broad-based — every segment is bigger. But revenue is the boring part. Operating income is where the real regime change lives:
2022 was brutal for retail. North America (−$2.8B) and International (−$7.7B) both lost money as Amazon over-built capacity during the pandemic boom and then ate the fixed costs. AWS profit ($22.8B) is the only reason the company stayed comfortably profitable that year. By 2025 retail had recovered, but AWS still earns more than the other two segments combined.
To make the margin story explicit, here are segment operating margins — operating income as a percentage of that segment’s own sales:
AWS runs at a ~35% operating margin — software economics. North America has clawed its way to ~7%, and International to ~3%. These are structurally different businesses stapled together.
4. What the market did with all this
The daily chart is noise on top of signal, though. To see what actually drives the price over years rather than days, the right lens is per-share metrics — because an investor doesn’t own “Amazon,” they own a share of it.
5. Do the profits actually turn into cash?
There’s an old auditor’s saying: “Profit is an opinion; cash is a fact.” Everything above — revenue, operating income, margins — comes from accrual accounting, which records sales when they’re earned and costs when they’re incurred, not when money actually changes hands. That’s the right way to measure economic activity, but it opens a gap between the profit a company reports and the cash it collects. A healthy skeptic always asks: do the earnings show up as real money?
There are three distinct things people worry about behind “great results on paper, but where’s the cash?” — and each has a different diagnostic:
| The worry | What it actually means | The tell-tale sign |
|---|---|---|
| Fictional revenue | Booking sales that won’t convert to cash (channel-stuffing, round-tripping, bill-and-hold). Outright aggressive or fraudulent recognition. | Operating cash flow runs persistently below net income; receivables grow faster than sales. |
| Delayed payments | Customers paying late (bad → receivables balloon) — or the company stretching its own suppliers (good → it’s free financing). | Rising days-sales-outstanding is the danger; rising days-payable is a benefit. |
| Non-cash earnings | Profit propped up by accounting estimates (e.g. low depreciation) or depressed by non-cash charges (stock comp, write-downs). | Net income and cash flow drift apart for “paper” reasons like useful-life assumptions. |
The way to settle the question is to walk from net income down to free cash flow — the cash left after running and maintaining and expanding the business. Here is that bridge for Amazon in FY2025.
Read the bridge left to right and the answer falls out:
- The operating cash is real — emphatically so. Operating cash flow ($139.5B) is nearly double reported net income ($77.7B). That is the opposite of the fictional-revenue signature, where cash lags profit. Most of the gap is depreciation & amortization ($65.8B): a genuine expense on the income statement, but one where no cash leaves the building this year — so it’s added back. Stock-based comp ($19.5B) works the same way (it dilutes shareholders rather than spending cash).
- “Delayed payments” actually works in Amazon’s favour. Amazon runs on negative working capital: customers pay instantly (card on file), while Amazon pays its suppliers weeks later. So its own slow payments are a source of cash — suppliers and customers effectively finance the business. The dangerous version (Amazon’s own customers stalling, receivables ballooning faster than sales) simply isn’t visible in the numbers.
So the popular “they have no cash!” worry, in the fraud sense, does not apply to Amazon. But there is a real catch — it’s just a different one:
The cash is real, but almost none of it is free. In 2025 Amazon turned $139.5B of operating cash flow into just $7.7B of free cash flow — because it plowed $131.8B into capex, overwhelmingly AI data centres and chips. So the honest version of the concern isn’t “the profits are fake.” It’s that the profits are real, but the company is reinvesting nearly all of its cash, so there’s little left over — and the whole thesis now rests on those AI investments earning a return.
The accounting subtlety worth knowing about
This is where depreciation and amortization timing becomes an earnings-quality issue, and it’s the part most people miss. When Amazon spends $132B on servers, the cash leaves immediately (it hits free cash flow right away), but the income statement only feels it gradually — spread out as depreciation over the asset’s “useful life,” typically 5–6 years. The mechanical consequence: in a year of heavy investment, reported operating income looks far healthier than free cash flow, because most of this year’s spending hasn’t yet shown up as depreciation. As today’s capex ages, that depreciation load climbs and becomes a growing drag on future operating income.
And “useful life” is an estimate — a management judgement that directly moves reported profit:
- In 2024, Amazon extended the assumed life of servers from 5 to 6 years, which lowered annual depreciation and boosted reported income.
- In 2025, it reversed course (6 → 5 years), citing the faster pace of AI hardware obsolescence — reducing 2025 operating income by roughly $0.7B.
- Over the same period Meta went the other way, extending server life to ~5.5 years and cutting its depreciation expense by ~$2.9B.
Same physical hardware, opposite accounting calls — and each one changes reported profit by billions. None of this is fraud; it’s the legitimate latitude in accounting estimates. But it’s exactly why a careful analyst treats reported earnings as a starting point and always reconciles them to cash.
Verdict on the “no real cash” worry: for Amazon it’s largely a myth in the fraud sense — operating cash flow exceeds profit, and its working-capital float generates cash rather than hiding a hole. The legitimate concerns are (1) capital intensity — free cash flow is thin because nearly everything is being reinvested in AI, and (2) depreciation timing — today’s strong operating income partly reflects spending that hasn’t hit the income statement yet. The question isn’t “is the cash real?” It’s “will the AI capex earn its keep?”
Data & sources
- Segment revenue & operating income (2021–2025): Amazon.com, Inc. Form 10-K (FY2025) and prior annual filings, via SEC EDGAR.
- Consolidated cost lines & cash-flow statement (FY2025): Amazon FY2025 Form 10-K.
- Q1 2026 results: Amazon Q1 2026 earnings release (reported Apr 29, 2026).
- Stock prices: Yahoo Finance via the
yfinancePython package, pulled at render time.
All figures are as reported by Amazon. This article is for educational and illustrative purposes and is not investment advice.